Score-P
The Score-P measurement infrastructure is a highly scalable and easy-to-use tool suite for profiling and event tracing. It supports a wide range of HPC platforms and programming models. Score-P provides core measurement services for a range of specialized analysis tools, such as Vampir, Scalasca Trace Tools, TAU, or Extra-P.
Typical questions Score-P helps to answer
- Which call-paths in my program consume most of the time?
- How much time is spent in communication or synchronization?
Workflow
- Preparation. To create measurements, the target program must be instrumented. Score-P offers various instrumentation options, including automatic compiler instrumentation or manual source-code instrumentation. As an alternative to automatic compiler instrumentation, events can be generated using a sampling approach.
- Measurement. The instrumented program can be configured to record an event trace or produce a call-path profile. Optionally, PAPI, rusage, and perf hardware metrics can be recorded. Filtering techniques allow precise control over the amount of data to be collected.
- Analysis. Call-path profiles can be examined in TAU or the Cube profile browser and serve as Extra-P input. Event traces can be examined in Vampir or used for automatic bottleneck analysis with Scalasca.
Platform support
Continoulsy tested on: HPE Cray XC and EX, various Linux (Intel, AMD, IBM, ARM) clusters with GNU, Intel, NVIDIA, IBM, and AMD compilers.
Previously tested on: Intel Xeon Phi, IBM Blue Gene/Q, Cray XT/XE/XK, Fujitsu FX systems
Programming models
Serial, MPI, OpenMP, Pthreads, CUDA, HIP, OpenCL, OpenACC, SHMEM
License
Open source: BSD
Homepage
Contact
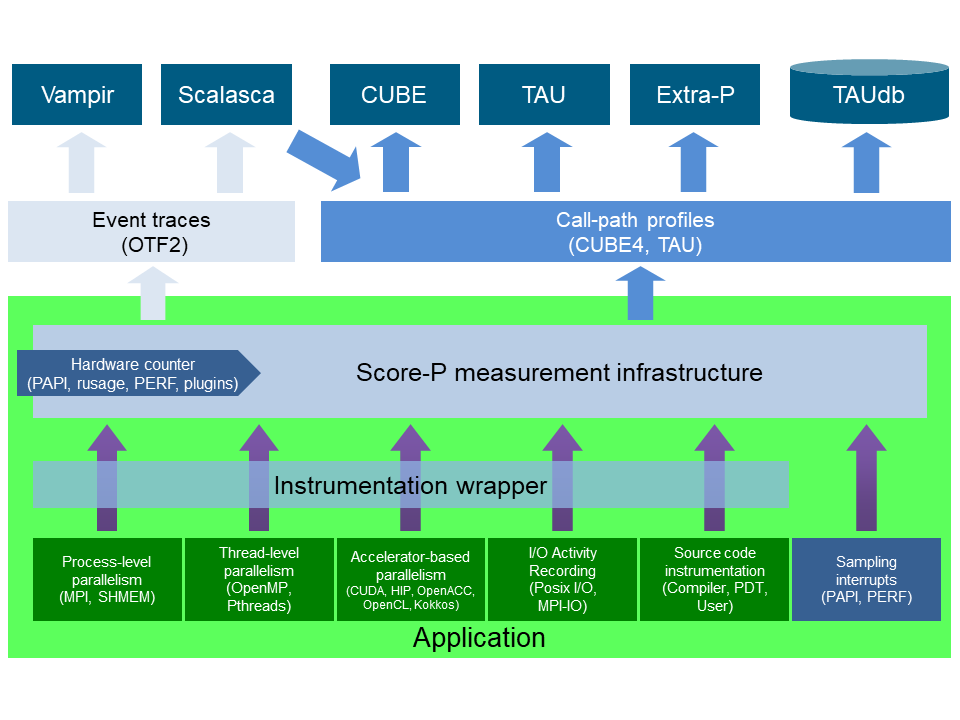
The figure below is an overview of the Score-P instrumentation and measurement infrastructure and the analyzing tools from the VI-HPS ecosystem. Supported programming models and other event sources are modularized at the lowest level. Score-P instruments the application at build time with the necessary code to perform the measurement. Measurement mode and any external sources such as PAPI are specified at runtime. The performance data is stored for postmortem analysis in the open data formats CUBE4 for call-path profiles and OTF2 for event traces. Multiple analysis tools can then work on the same data from a single measurement run.